Basketball Statistics

What to Discover or Recall:

Discover, while the final score is paramount, how the score is achieved is of the utmost importance for future play.
Find out the three progressive phases coaches go through in implementing statistics.
Comprehend that to be of value, statistics must be presented in a form that coaches can quickly understand and use.
Find out that the wealth of information generated in statistical reports and shot charts have a definite impact on the outcome of a game.
Lastly, explore the variety of available reports.

Cybersports Logo

The value of stats can be anywhere from being meaningless numbers to an essential coaching aid.

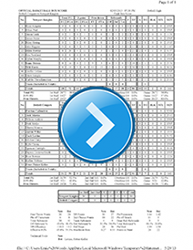
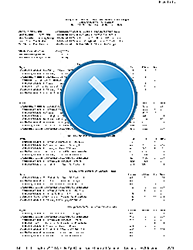
No longer are coaches limited to the basic statistics. Software programs, such as Cybersports for basketball, not only compile statistics with a click of the mouse, but they also generate detailed reports that present this information in a form that coaches can quickly understand and use. Box score reports have now been enhanced to include new statistics, such as Defensive Stops, Defensive Assists, Fouls Drawn, Assist Attempts, Second Effort Points, and Points per Possession.

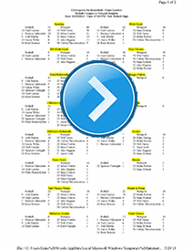
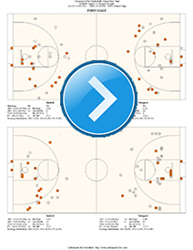
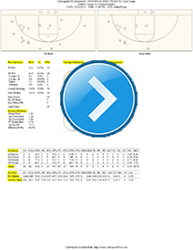
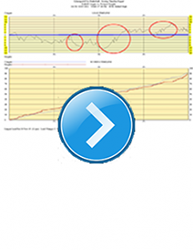
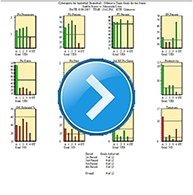
In addition, a multitude of easy to comprehend reports are also produced such as shot charts, leader reports, line up analyses, detailed play-by-play, team goals, and graphical team comparisons. Cumulative or season statistics can be instantly generated and an array of team and individual player cumulative reports similar to the game reports are produced, a task that once took days to achieve. Two teams or two players can even be matched and compared statistically before a game is even played. Available game reports:

| Boxscore | Leaders | Play-by-Play | Shot Charts | Graphical Comparison | Timeline | Lineup | Game Goals |

Boxscore

Boxscore Reports

The traditional game boxscore reports have now been enhanced and expanded to include: Shooting Percentages by Period, Points off Turnovers, Second Effort Points, Bench Points, Points in the Paint, 3 Point Points, Free Throw Points, Points per Shot, Offensive Rebounding Percentage, Defensive Rebounding Percentage, Defensive Stops, Largest Leads, Lead Changes, Number of Ties, and Longest Runs

Leaders Report

Leaders Reports

The leaders Report is actually a quick look boxscore report broken down by categories. Players on both teams are ranked and listed according to each category. Categories include: Scoring, Field Goals, 3Point Field Goals, Free Throws, Total Rebounds, Offensive Rebounds, Defensive Rebounds, Charges Taken, Assists, Assist Attempts, Turnovers, Block Shots, Second Effort Points, Points in Paint, Defensive Assists, Fouls Drawn, Fouls and Productivity. This quick look leaders report is an excellent report, especially at half time, since it can be quickly scanned and analyzed.

Play by Play

Play-by-Play Reports

The Play-by-Play report is a sequential listing by time of every event and action that occurred during the game. Play-by-play report is a favorite report of the media. In addition of listing each game action by player and time, it shows the running score along with the difference in score. It also tracks the lead changes and ties during the game. It also generates End of Period Summaries. The Play-by-Play report also has a scoring only version option.

Detailed Play-by-Play reports can be a value in resolving in game disputes such as the number of fouls on a player, number of timeouts taken, etc. Play-by-Play reports can be of great benefit in post game reviewing of game video since they act as a script showing what led up to a certain event, and what came after it.

Game Shot

Game Shot Chart Report

Shot by location charts include game, team and individual shot charts. They show graphically the location where each shot is taken during a game. Since the game shot chart shows the shot locations of both teams by half, it is an excellent half time report.

Team Shot

Team Shot Chart

Team shot charts not only show a composite of a team's made and missed shot locations, but in addition includes shot summaries, scoring break downs, scoring efficiencies along with pie graphs showing scoring distributions, court locations and range.

All Players

Team Shot Chart - Individual Players

A second page of the team shot chart shows all the individual players' shots by location on one report.

Individual Player Shot Chart

Individual Player Shot Chart

Individual player shot charts are similar to the team shot chart listing shot summaries, scoring break downs, scoring efficiencies along with pie graphs showing scoring distributions, court locations and range in addition to made and missed shot locations.

comparison Report

Graphical Comparison Report

The Graphical Comparison report compares both teams graphically. This report eliminates having to have a working knowledge of what the various statistical numbers represent. This report compares graphically the following areas: Scoring: Total Points, Points per Possession, Layup Points, 3 Point Points, Free Throw Points, Points in the Paint, Second Effort Points, Points Off Turnovers, and Bench Points. Shooting: Field Goal Percentage, 3Point FG Percentage, and Free Throw Percentage, Rebounding: Offensive Rebound Percentage, Defensive Rebound Percentage, and Total Rebound Percentage Ball Handling: Assists, Turnovers, and Ball Handling Error Percentage Defense: Defensive Assists, Steals, Defensive Stops, Charges Taken, Defensive Fouls, and Blocked Shots Miscellaneous: Productivity, Offensive Efficiency, and Defensive Efficiency.

Period Comparison

Period Comparison Box Score Report

The Period Comparison Box Score is a color coded comparison of the team statistics by period showing the differential for each statistic. 

Timeline

Timeline Report

The Timeline report is a line graph showing the difference in score as the game progresses. It points out graphically the offensive runs that occur during a game. This report is especially valuable as a time saver and guide in reviewing video of the game since runs, which determine the outcome of games, can quickly be determined and visually analyzed.

Lineup Report

Lineup Combinations Report

The Lineup Combination reports are an exciting tool to assist coaches in tracking and evaluating the effectiveness of various lineups used during a game or season. Often times, a player may not have any significant statistics, yet their presence on the floor is vital and they are consistently listed in the top lineup reports. On the other hand, players with big scoring and rebounding numbers can, on occasions, actually be detrimental to a team and will be listed in negative or non-productive lineups. Lineup analysis include: Most Used, Most Productive, Best Rebounding, Best Defensive, Best to Make a Defensive Stop, Best to Force Turnovers, etc. The lineup analysis reports are also a valuable scouting tool. Knowing the opponent's most used lineups is definitely a big advantage.

Team Goals

Team Goals Report

Individual & Team Goal Reports are graphically illustrated and are user definable in that each category can be customized to fit any program. They allow for the tracking of 12 different offensive categories: Pts/Possession, Pts/Game, Pts/Shot, 2nd Effort Pts, FG%, 3FG%, FT%, Ballhandling Err%, Assists/Game, Turnovers/Game, Off Reb%, and Productive (+/-). Defensive goals include: Opp Pts/Possession, Opp Points/Game, Opp Pts/Shot, Opp FG%, Opp 3FG%, Opp Ball Handling Err%, Def Ast/Game, Steals/Game, Def Reb%, and Charges Taken/Game.

These categories are further broken down by period and are displayed as color coded bar graphs. A summary of goals achieved is also included on the game report. In the season report, the goals are represented as a line graph, and are excellent tools for analyzing individual player and team tendencies. You can quickly determine which categories are improving and which ones need to be improved.

Learn More Available Season Reports

Learn More What the Reports Really Tell


Return to Post Game - Click Here

Return to Coaching Strategies - Click Here

Return to HoopTactics - Click Here