Season/Cumulative Statistics

What to Discover or Recall:

Discover, while the final score is paramount, how the score is achieved is of the utmost importance for future play.
Season or Cumulative reports are an excellent source for analyzing team and individual player performances and tendencies.
They are a vital tool in preparing for future play and individual player improvement,

Cybersports Logo

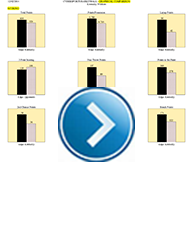
Season or cumulative reports are similar to game reports. They consist of a multitude of easy to understand and comprehend team and individual reports. These reports include cumulative: boxscores, shot charts, leader reports, lineup analyses, graphical team comparisons and season tendencies. In analyzing the season reports provides coaches with a better understanding of their team's strengths and weaknesses. This information is priceless in planning and carrying out practices and future play.

| Available Team Reports | Available Player Reports | Basketball Analytics |


5 Stars

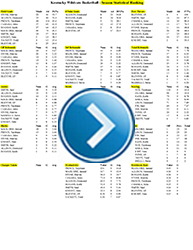
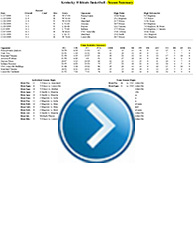
Available Team Season Reports


| Boxscore | Leaders | Summary | Shot Charts | Graphical Comparison | Lineup Analysis | Graphical Tendencies |

Season Box

Season Boxscore Reports

The season or cumulative game boxscore report includes: Win/Loss Record breakdowns and percentages along with Site and Win/Loss statistical performances. Individual Player Season Statistics, Team & Opponent Season Totals along with Shooting, Rebounding, Ball Handling, Scoring, and Other statistical breakdown comparisons.


Season Leaders

Season Leaders Reports

The season leaders Report is actually a quick look season boxscore report broken down by categories. Players are ranked and listed according to each category. Categories include: Scoring, Field Goals, 3Point Field Goals, Free Throws, Total Rebounds, Offensive Rebounds, Defensive Rebounds, Charges Taken, Assists, Turnovers, Fouls Drawn, Fouls and Productivity.

Season Summary

Season Summary Reports

The season summary report is a sequential listing the game played showing date, team record, sites, score, opponent, along with high scorer and rebounder. It also shows the team stats for each game. In addition, it lists the individual and team single game highs for most points, most FG made & attempted, most 3FG made & attempted, most FT made & attempted, most offensive, defensive and total rebounds, most assists, most steals, and most blocked shots.

Season Shot Char

Season Team Shot Chart

Similar to a game shot chart, this season shot chart not only show a composite of a team's made and missed shot locations, but also includes shot summaries, scoring break downs, scoring efficiencies along with pie graphs showing scoring distributions, court locations and range. In addition, it compares the season team and opponent total and average statistics.

Comparison

Graphical Season Comparison Report

The Graphical Comparison report compares a teams season totals to the opponents. This report compares graphically the following areas:

Scoring: Total Points, Points per Possession, Layup Points, 3 Point Points, Free Throw Points, Points in the Paint, Second Effort Points, Points Off Turnovers, and Bench Points. Shooting: Field Goal Percentage, 3Point FG Percentage, and Free Throw Percentage, Rebounding: Offensive Rebound Percentage, Defensive Rebound Percentage, and Total Rebound Percentage Ball Handling: Assists, Turnovers, and Ball Handling Error Percentage Defense: Defensive Assists, Steals, Defensive Stops, Charges Taken, Defensive Fouls, and Blocked Shots Miscellaneous: Productivity, Offensive Efficiency, and Defensive Efficiency.

Season Lineup

Season Lineup Combinations Report

The Lineup Combination reports are an exciting tool to assist coaches in tracking and evaluating the effectiveness of various lineups used during the season. Often times, a player may not have any significant statistics, yet their presence on the floor is vital and they are consistently listed in the top lineup reports. On the other hand, players with big scoring and rebounding numbers can, on occasions, actually be detrimental to a team and will be listed in negative or non-productive lineups. Lineup analysis include: Most Used, Most Productive, Best Rebounding, Best Defensive, Best to Make a Defensive Stop, and Best to Force Turnovers.

Season Tendencies

Season Team Tendencies Report

Season team tendencies reports are line graphs tracks a team's performance in 16 different categories: Pts/Possession, Pts/Game, Pts/Shot, FG%, 3FG%, FT%, Assists, Turnovers, Off Reb%, Productive (+/-), Opp Pts/Possession, Opp Points/Game, Opp Pts/Shot, Opp FG%, Opp 3FG%, , Steals, Def Reb%, and Charges Taken/Game. These line graphs, and are excellent tools for analyzing individual player and team tendencies. You can quickly determine which categories are improving and which ones need to be improved. The goal line is user definable in that each category can be customized to fit any program on any level.


5 Stars

Available Player Season Reports

Season individual player reports consist of cumulative player statistics, cumulative shot charts, season tendencies and season player evaluations.


| Season Box | Season Shot Chart | Season Tendencies | Season Evaluation |

Player Box

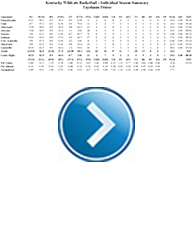
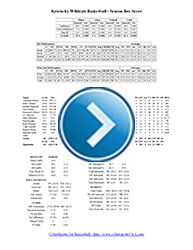
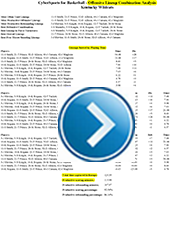
Individual Player Season Summary

This season boxscore list a player's statistical performance by game. It includes cumulative totals, game higns, averages per game, per minute and normalized (a theoretical average if they played an entire game).

Season Shot Chart

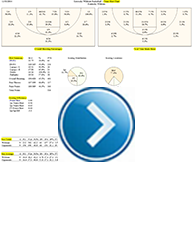
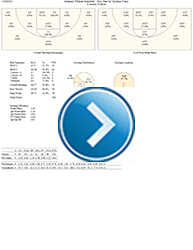
Individual Player Shot Chart

Individual player season shot charts are similar to the team shot chart showing made and missed shot locations as well as percentages. They also show the locations and percentages of their made shots. The season shot chart also includes shot summaries, scoring break downs, scoring efficiencies along with pie graphs showing scoring distributions, court locations and range. In addition, it lists a player's season average, per game average, per minute average, and normailized average (a theoretical average if they played an entire game).

Tendencies

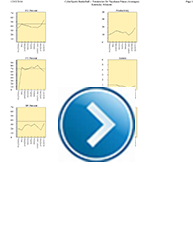
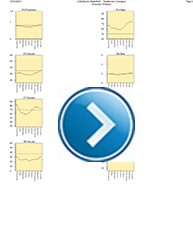
Player Tendencies Report

Season tendencies report are line graphs tracking a player's performance in 9 different categories: FG%, 3FG%, FT%, Assists, Steals, Productive (+/-), Turn Overs, Off Rebounds and Def Rebounds. These line graphs, and are excellent tools for analyzing individual player performance and tendencies. You can quickly determine which categories are improving and which ones need to be improved. The goal line is user definable in that each category can be customized to fit any program on any level.

Player Evaluation

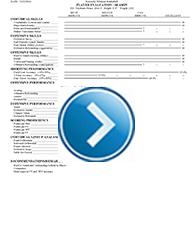
Season Player Evaluation

Easy to read and understand graphical player evaluations are found both in the game and season modules. These evaluations consist of: subjective evaluation, game performance evaluation, and personal comments. The CyberSports rating system of excellent, could improve, should improve and must improve lets the players know exactly where they stand in all phases of the game. These reports are a very valuable tool at the end of the season for player evaluation and for planning off season development. They also can be used in tryouts and squad selection.

Learn More Available Game Reports


5 Stars

More Than Just Numbers

We now live in a world of information, however, to be of value this information must be presented in a meaningful and usable manner. This is where software programs like CyberSports for basketball excel. These software programs not only compile statistics with a click of the mouse, but they also generate reports that present this information in a form that coaches can quickly understand and use.

Learn More What the Reports Really Tell


Return to Post Game - Click Here

Return to Coaching Strategies - Click Here

Return to HoopTactics - Click Here